User Manual
We believe that use of the CTGViewerLite is simple and intuitive. Below we provide only a specific usage.
Annotator
The Annotation Toolbar can be opened using (View -> Annotation Toolbar -> Show) and can be moved to any side of the application.
The annotation buttons can be moved right using (View -> Annotation Toolbar -> Align right)
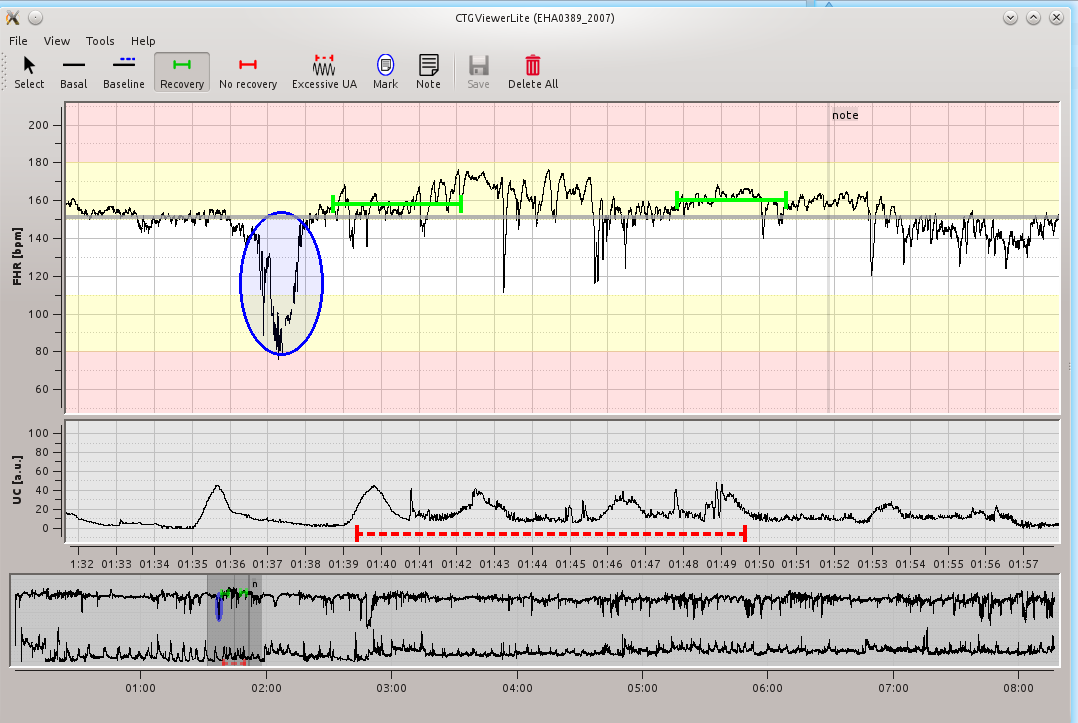
Annotations features:
Open directory with files: open data folder for browsing (File -> Open Folder). Select the data folder then data files should be listed on the left.
Basal: left click at the FHR plot
Baseline: left click at the FHR plot and hold the left button, draw a baseline in a desired interval
Recovery: the same functionality as for baseline
No recovery: the same functionality as for baseline
Excessive uterine contractions: the same functionality as for baseline
Mark: left click at a plot and hold the left button, draw an ellipse (a note could be added to ellipse by entring text)
Add note: left click at a plot and enter text note
- Select tool:
- Change basal: left click at basal (it should become highlighted), hold the left button to move it
- Change position of baseline/recovery: left click at baseline/recovery (it should become highlighted), hold the left button and move it.
- Change length of baseline/recovery: left click at begin/end of baseline/recovery (it should become highlighted), hold the left button and move it.
- Change mark (ellipse) text: double click at the mark (ellipse) (left click on the text does not work only horizontal line)
- Change note text: double click at the note’s horizontal line (left click on the note’s text does not work only horizontal line)
- Delete single annotation: left click at basal/baseline/recovery/note (it should be highlighted) and press key delete.
Enable/Disable Annotation toolbar: check/uncheck View -> Annotation Toolbar -> Show
Align buttons at Annotation toolbar: right/left - check/uncheck View -> Annotation Toolbar -> Align right
The annotations can be saved at any time using tool Save.
Sent annotations
When the annotations are completed. They can be automatically sent using a tool in (Tools -> Sent Annotations).
All annotations in the provided directory will be automatically sent.
Supported file formats
- *.dat - physionet format, the CTU-UHB database files (the application expect that for each file the *.hea file is provided)
- *.mat - matlab files, the application expect defined variables names, for details see LoadWriteData.EnumVariableName
- *.csv - comma separated value format
Convert physionet format to csv
The conversion of files can be done open using menu (Tools -> Convert files)
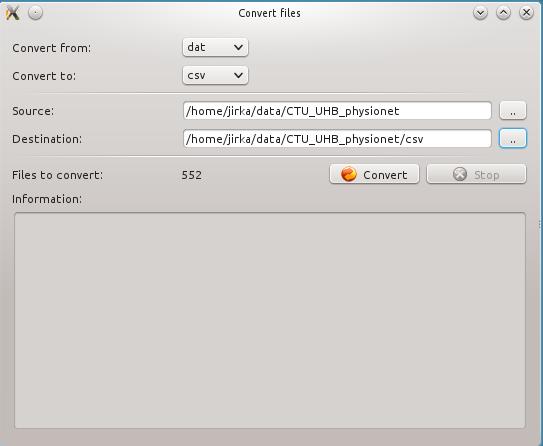
In the Convert files form the input and output format must be specified together with source and destination directory. The source and destination directory can be the same.
The conversion is only available from dat to csv. The other formats are not implemented yet. If you are interested in other format please contact us.
Download all files of CTU-UHB CTG database
The download utility can be open from menu (Tools -> Download CTU-UHB data)
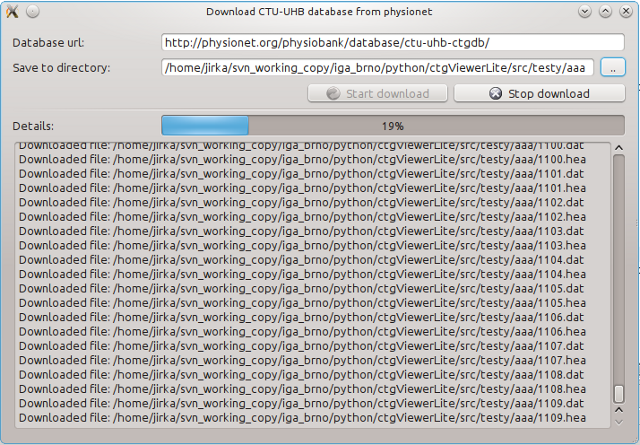
The following information need to be specified:
- database web adress (url): http://physionet.org/physiobank/database/ctu-uhb-ctgdb/
- destination directory. It is recommended to download database into an empty directory.
The downloading may take up to several minutes (depending on Internet connection). The downloaded files can be then opened in the menu (File -> Open file).
Command line interface
The following arguments can be used:
- -h, –help - show a help message and exit
- -p, –physionet-file - input file in the physionet format
- -m , –matlab-file - input file in the matlab format
Examples
> python ctgViewerLite.py -p 1001.dat
> python ctgViewerLite.py -m 1001.mat
Calling the CTGViewerLite from Matlab
The data in Matlab can be viewed by the CTGViewerLite. The CTGViewerLite is run as a separate process and loads data from Matlab. The data are first saved into a matlab file and then loaded in the CTGViewerLite application. There are two essential matlab files:
- python.m runs a python script
- plotCTGViewerLite.m plot the fetal heart rate and uterine contractions
Example of usage:
variables:
afFHR       [Nx1] contains fetal heart rate
afUC        [Nx1] contains uterine contraction
anTimestamp [Nx1] contains time samples
run as:
plotCTGViewer(anTimestamp,afFHR,afUC)
The code has been tested under linux only. Contact us in case of trouble.